The 500 Organization Reality Check
This is part five of our series on empirical exposure management. Data from 500+ organizations in P2P Vol. 8 showed that 95% of enterprise assets already carried a top-tier exploitable vulnerability when the CVE firehose was 18,000 a year; at 48,000+ in 2025 and climbing, that exposure has only compounded while remediation capacity has not.
Three charts from the Prioritization to Prediction Vol. 8 study tell you everything you need to know about why the vulnerability conversation in 2026 is broken. The report examined more than 500 organizations, millions of assets, and hundreds of millions of vulnerability instances. That sample is large enough to stop arguing from anecdote.
Start with the denominator. In 2021, when P2P v8 was published, roughly 18,000 new CVEs hit the list each year. That felt like a lot. In 2025, 48,185 were published. The annualized growth rate has held at about 16% for seven years running, and FIRST's 2026 forecast places the median estimate north of 50,000, with realistic scenarios stretching past 100,000. The firehose tripled. The hose diameter of every remediation team did not.
Against that backdrop, three figures from the study (I’ve re land differently than they did when the ink was fresh.
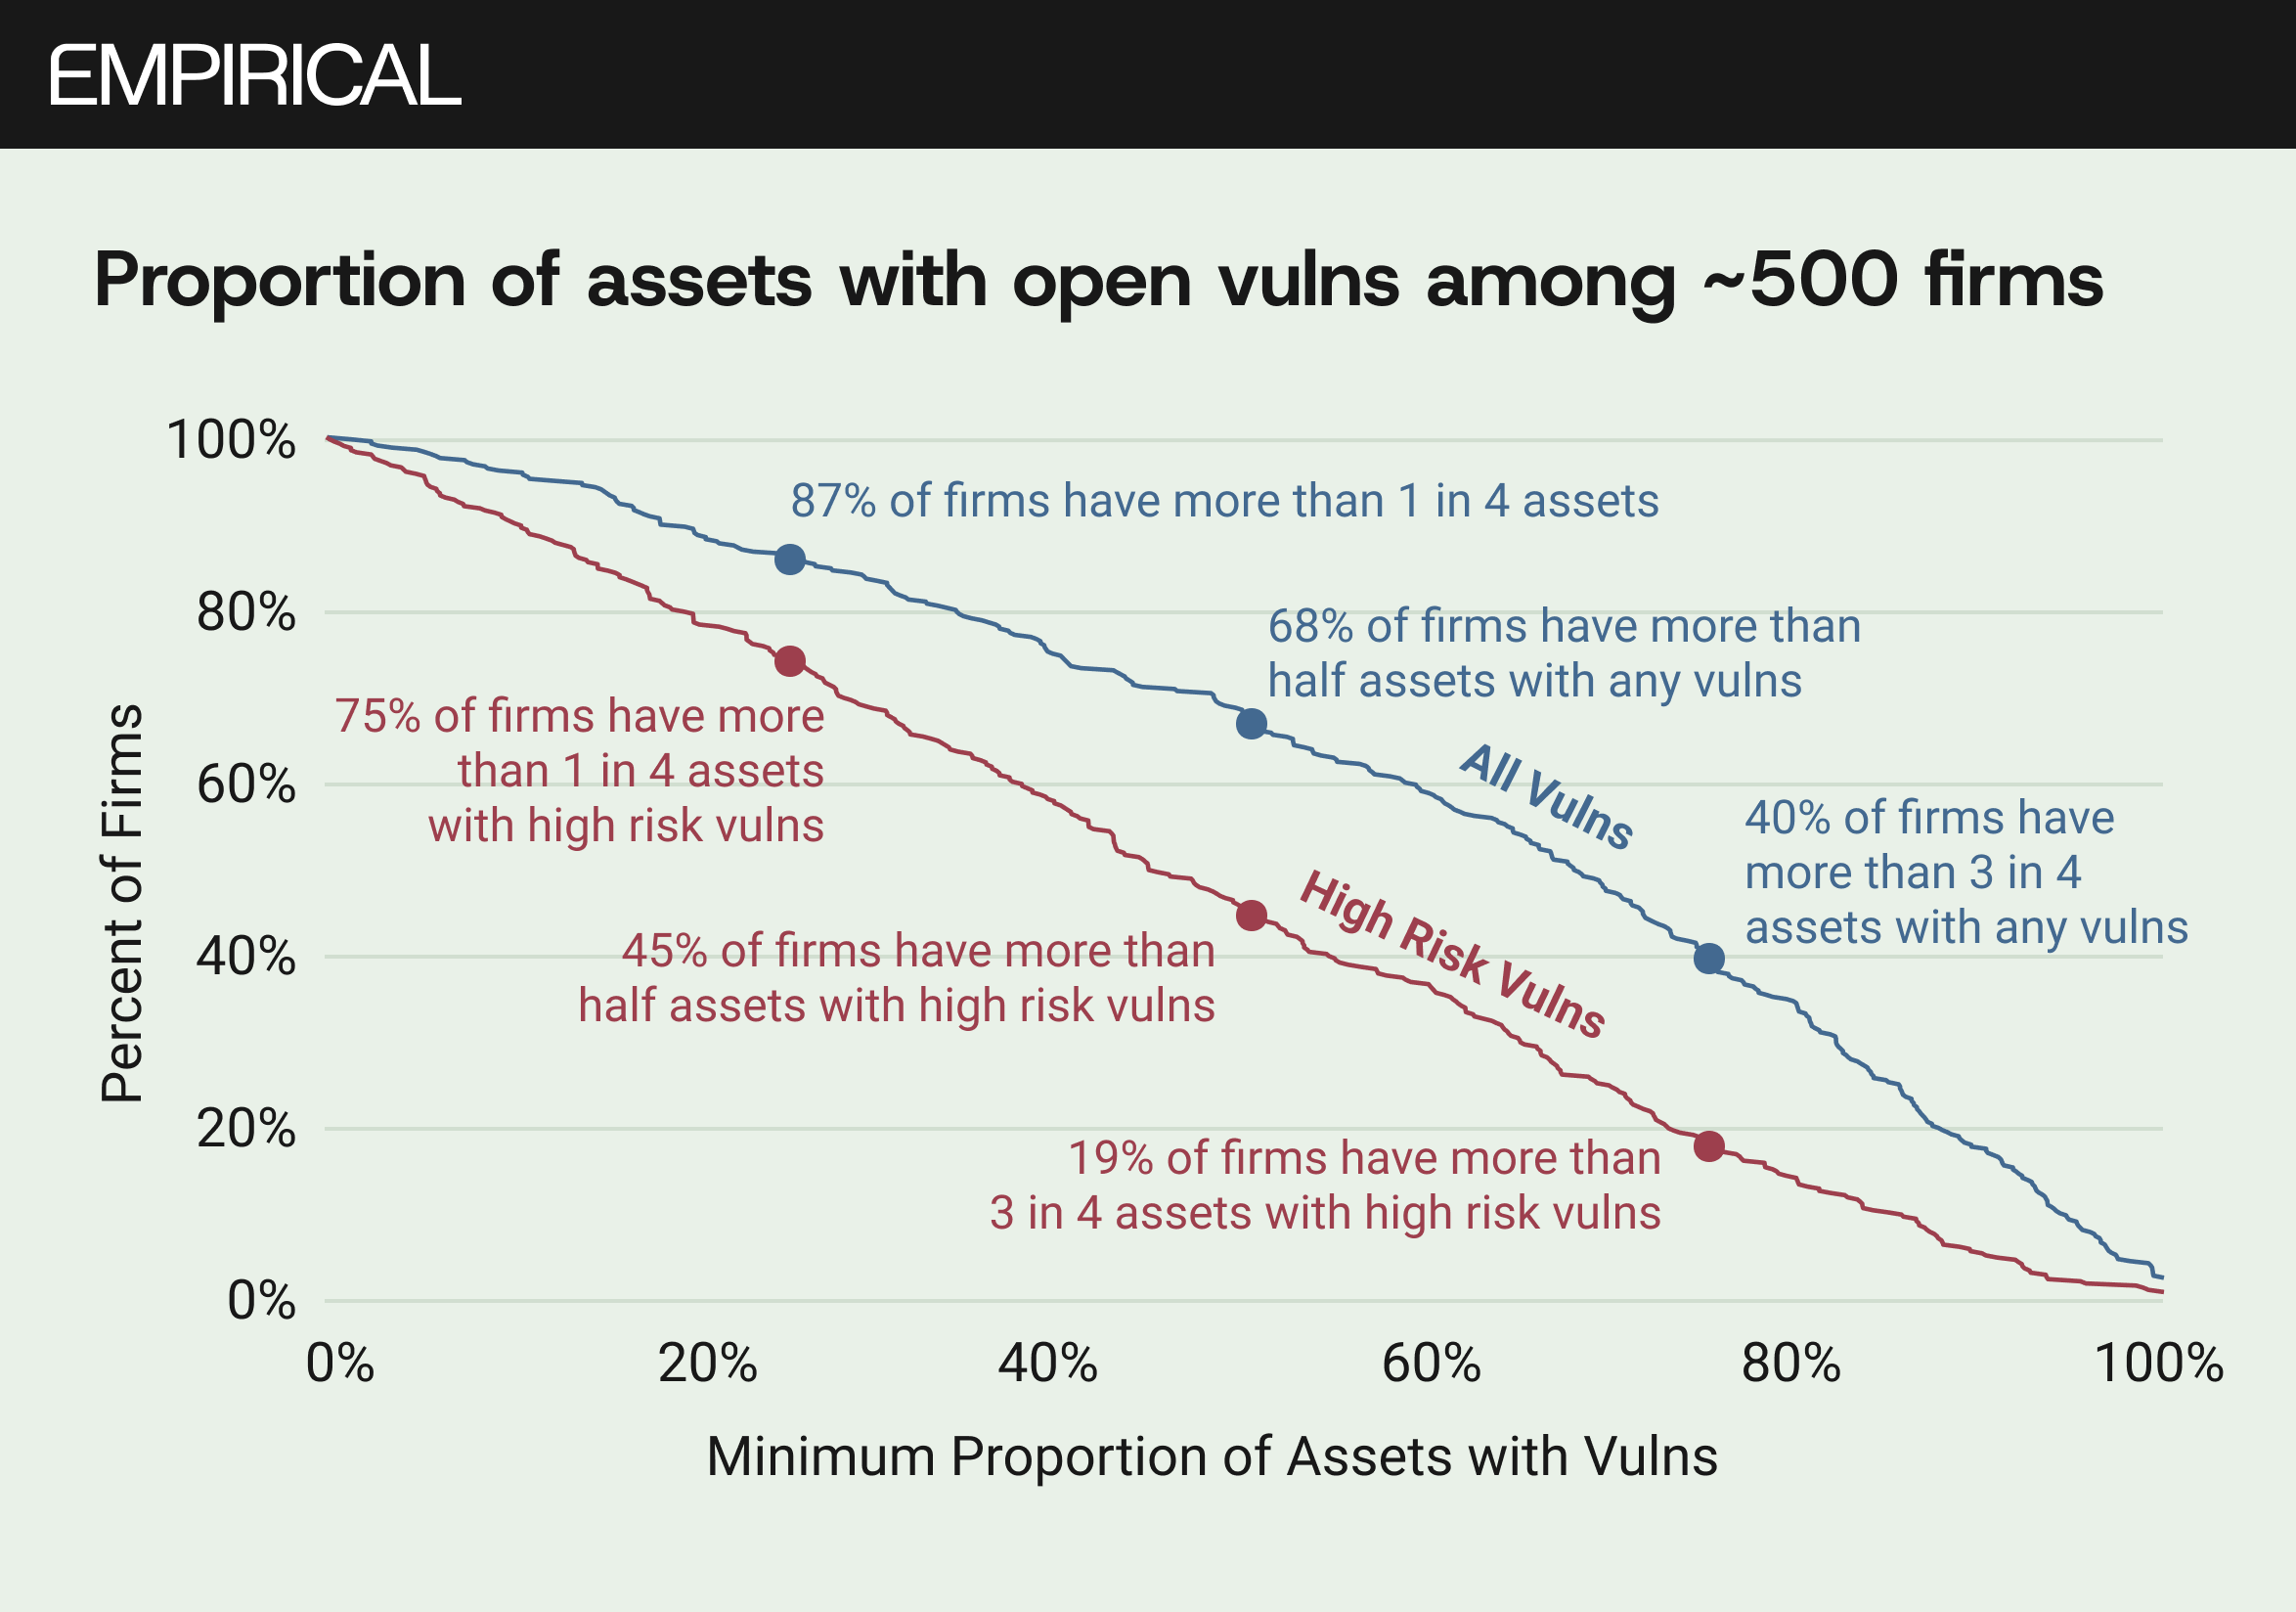
Figure 1 plots the proportion of active assets with open vulnerabilities across the ~500 firms. Eighty-seven percent of organizations showed vulnerabilities on more than a quarter of their assets. Sixty-eight percent showed them on more than half. Follow the high-risk line (those CVEs with known exploit code or active exploitation in the wild) and 75% of firms still had at least one in four assets sitting in the blast radius. Nineteen percent had three in four.
Those numbers were generated during a year of 18,000 new CVEs. Extrapolate them into a year of 48,000 and ask yourself what the curve looks like today. The asset filter, which the P2P series has long championed as the first and best way to cut the firehose, still works in theory. In practice, more CVEs mean more scanner detections, more findings per asset, more noise for every team running triage at 7am on a Tuesday.
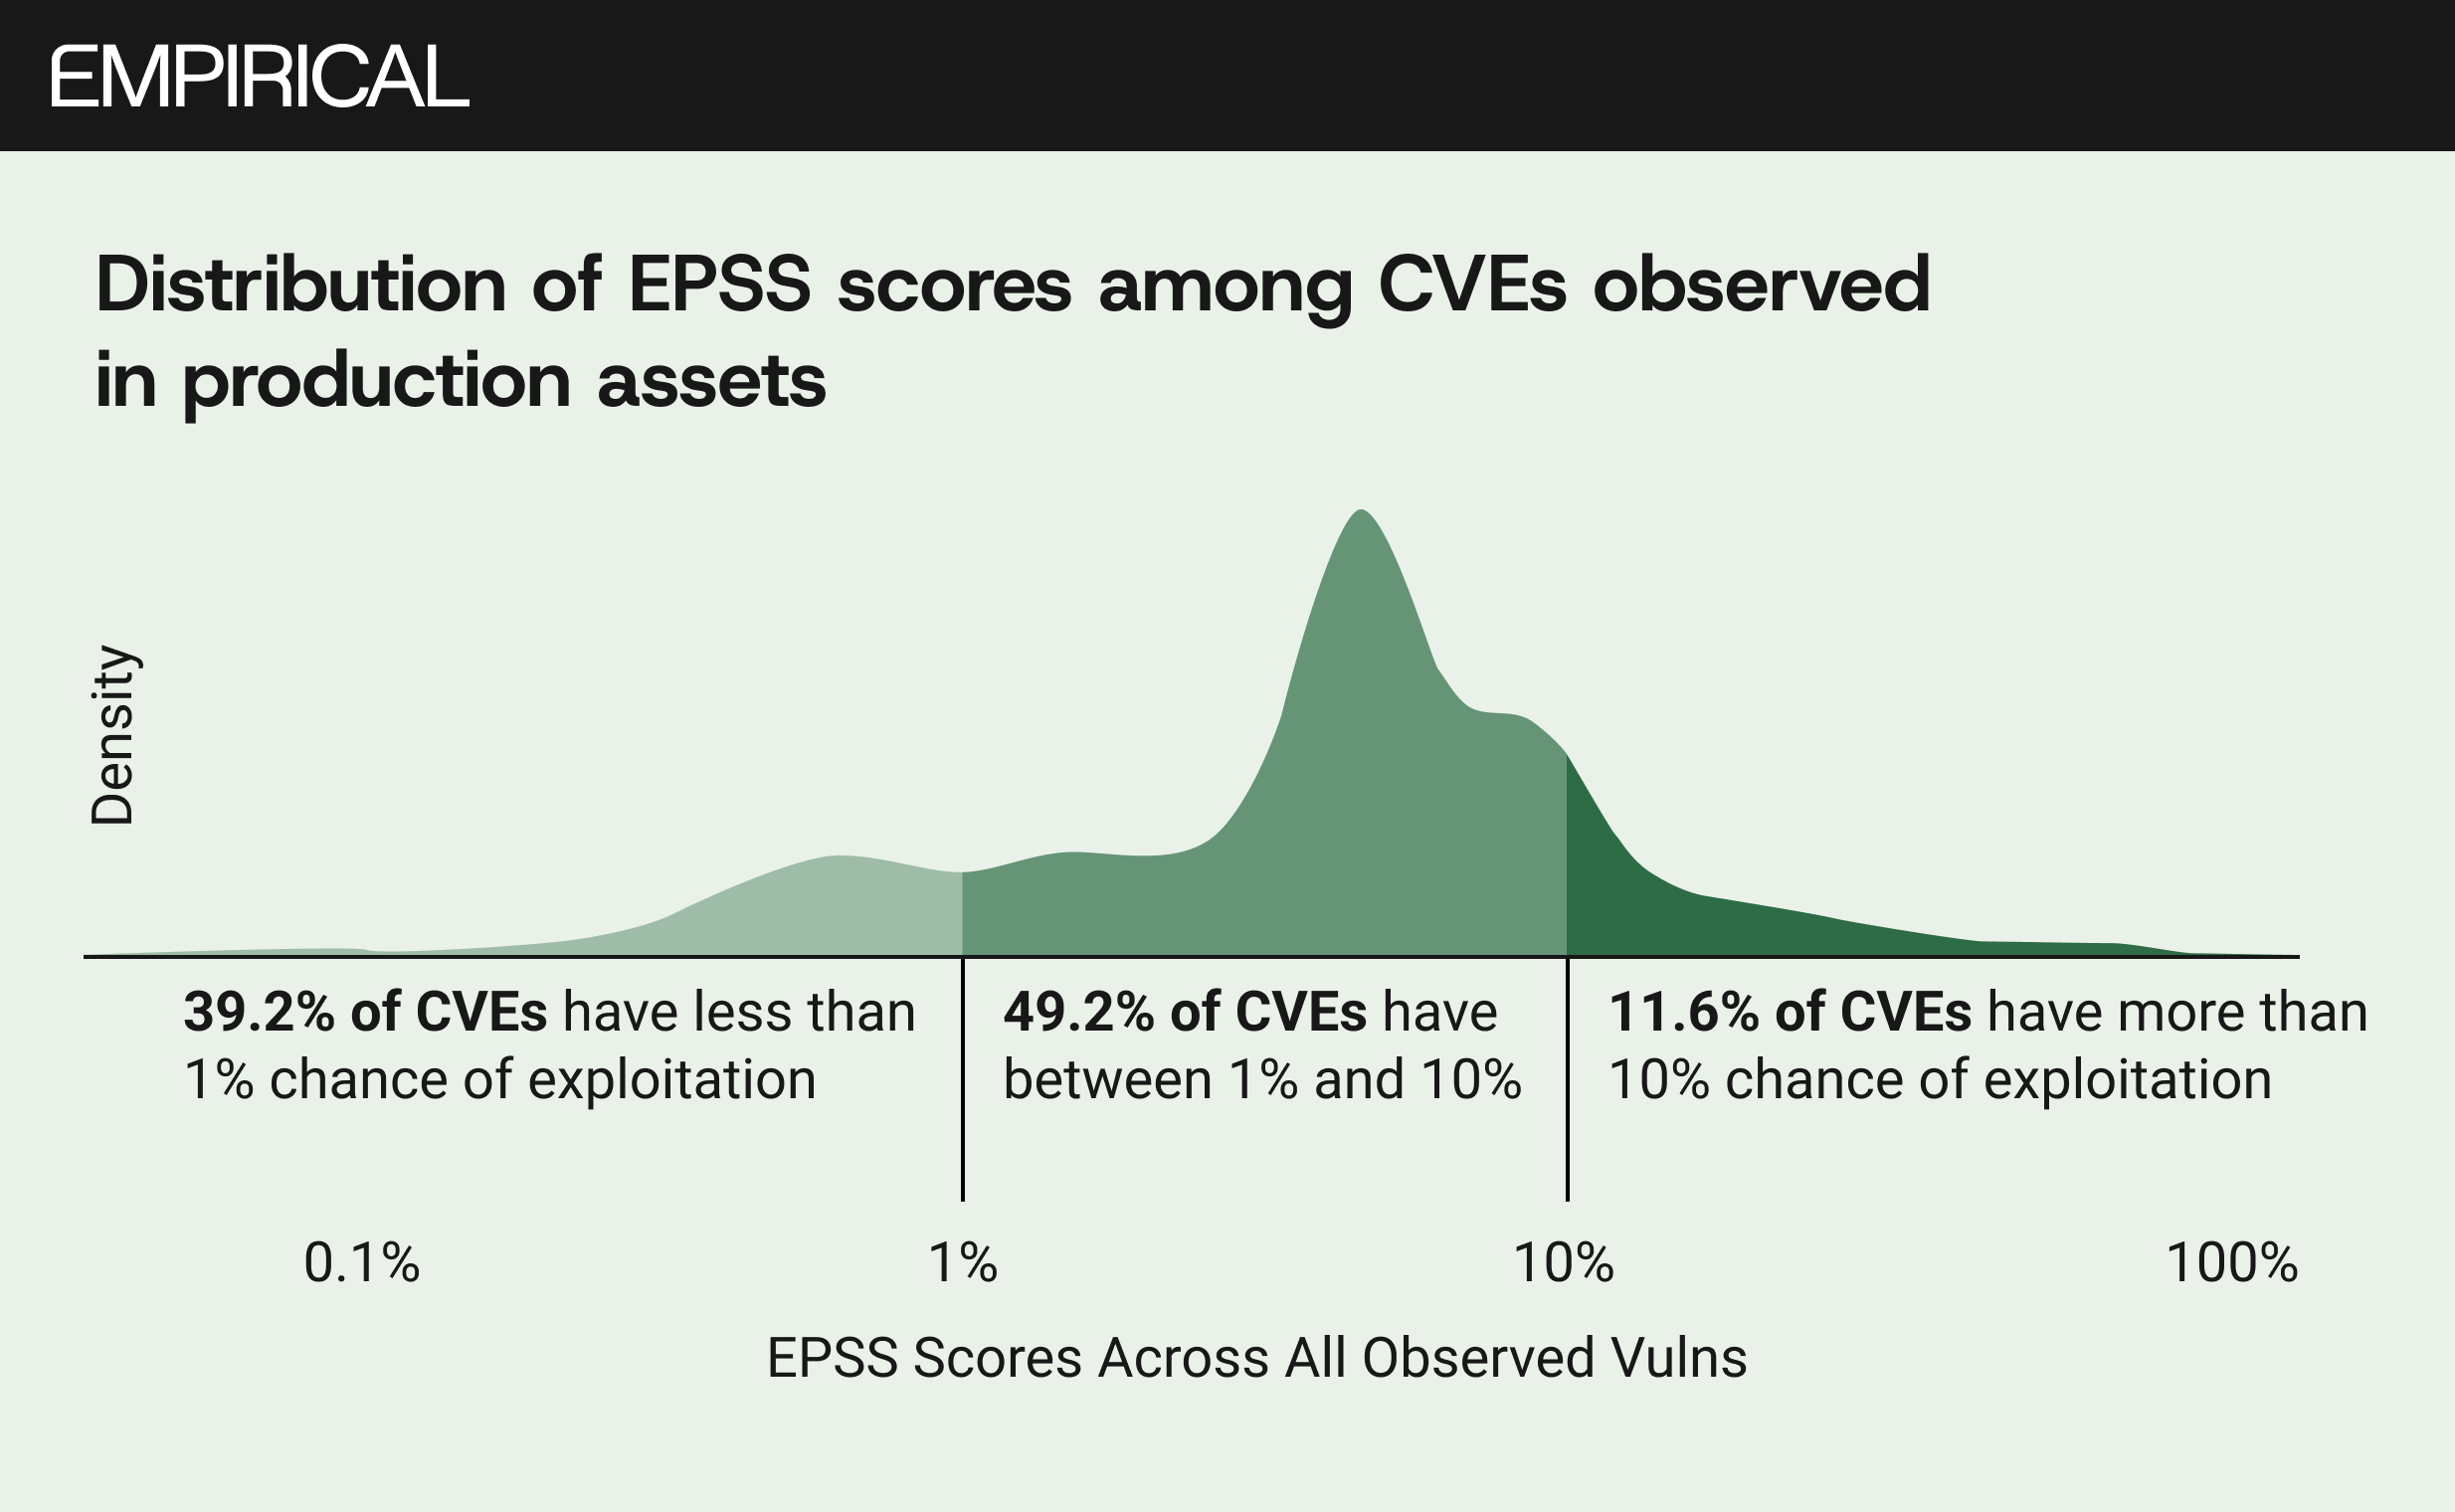
Figure 2 is the one I keep coming back to. It shows the distribution of EPSS scores across CVEs actually observed in production. Compared to the full CVE list, the distribution shifts right, hard. Among all published CVEs, 63% carry less than a 1% probability of exploitation. Among those observed in live enterprise environments, that share drops to 39%. Nearly half (49%) sit in the 1-to-10% band, and almost 12% exceed a 10% chance.
This is the selection effect that the industry consistently ignores. Attackers do not pick targets at random from the CVE list. They go where the install base is large, the exploit code is available, the patch cadence is slow. The software that organizations actually run is, by construction, the software that attracts weaponization. So measuring exploitability against the full CVE list, as most vendor dashboards do, flatters the defender. The denominator is wrong.
In a world where we have crossed 300,000 cumulative published CVEs and are on pace to add another 50,000 or more this year, the right denominator is not the CVE list. It is the subset that scanners find in your environment. And within that subset, one in nine vulnerabilities already carries a meaningful probability of exploitation. That ratio is only going to compress as more CVEs are published and more exploit code becomes available faster.
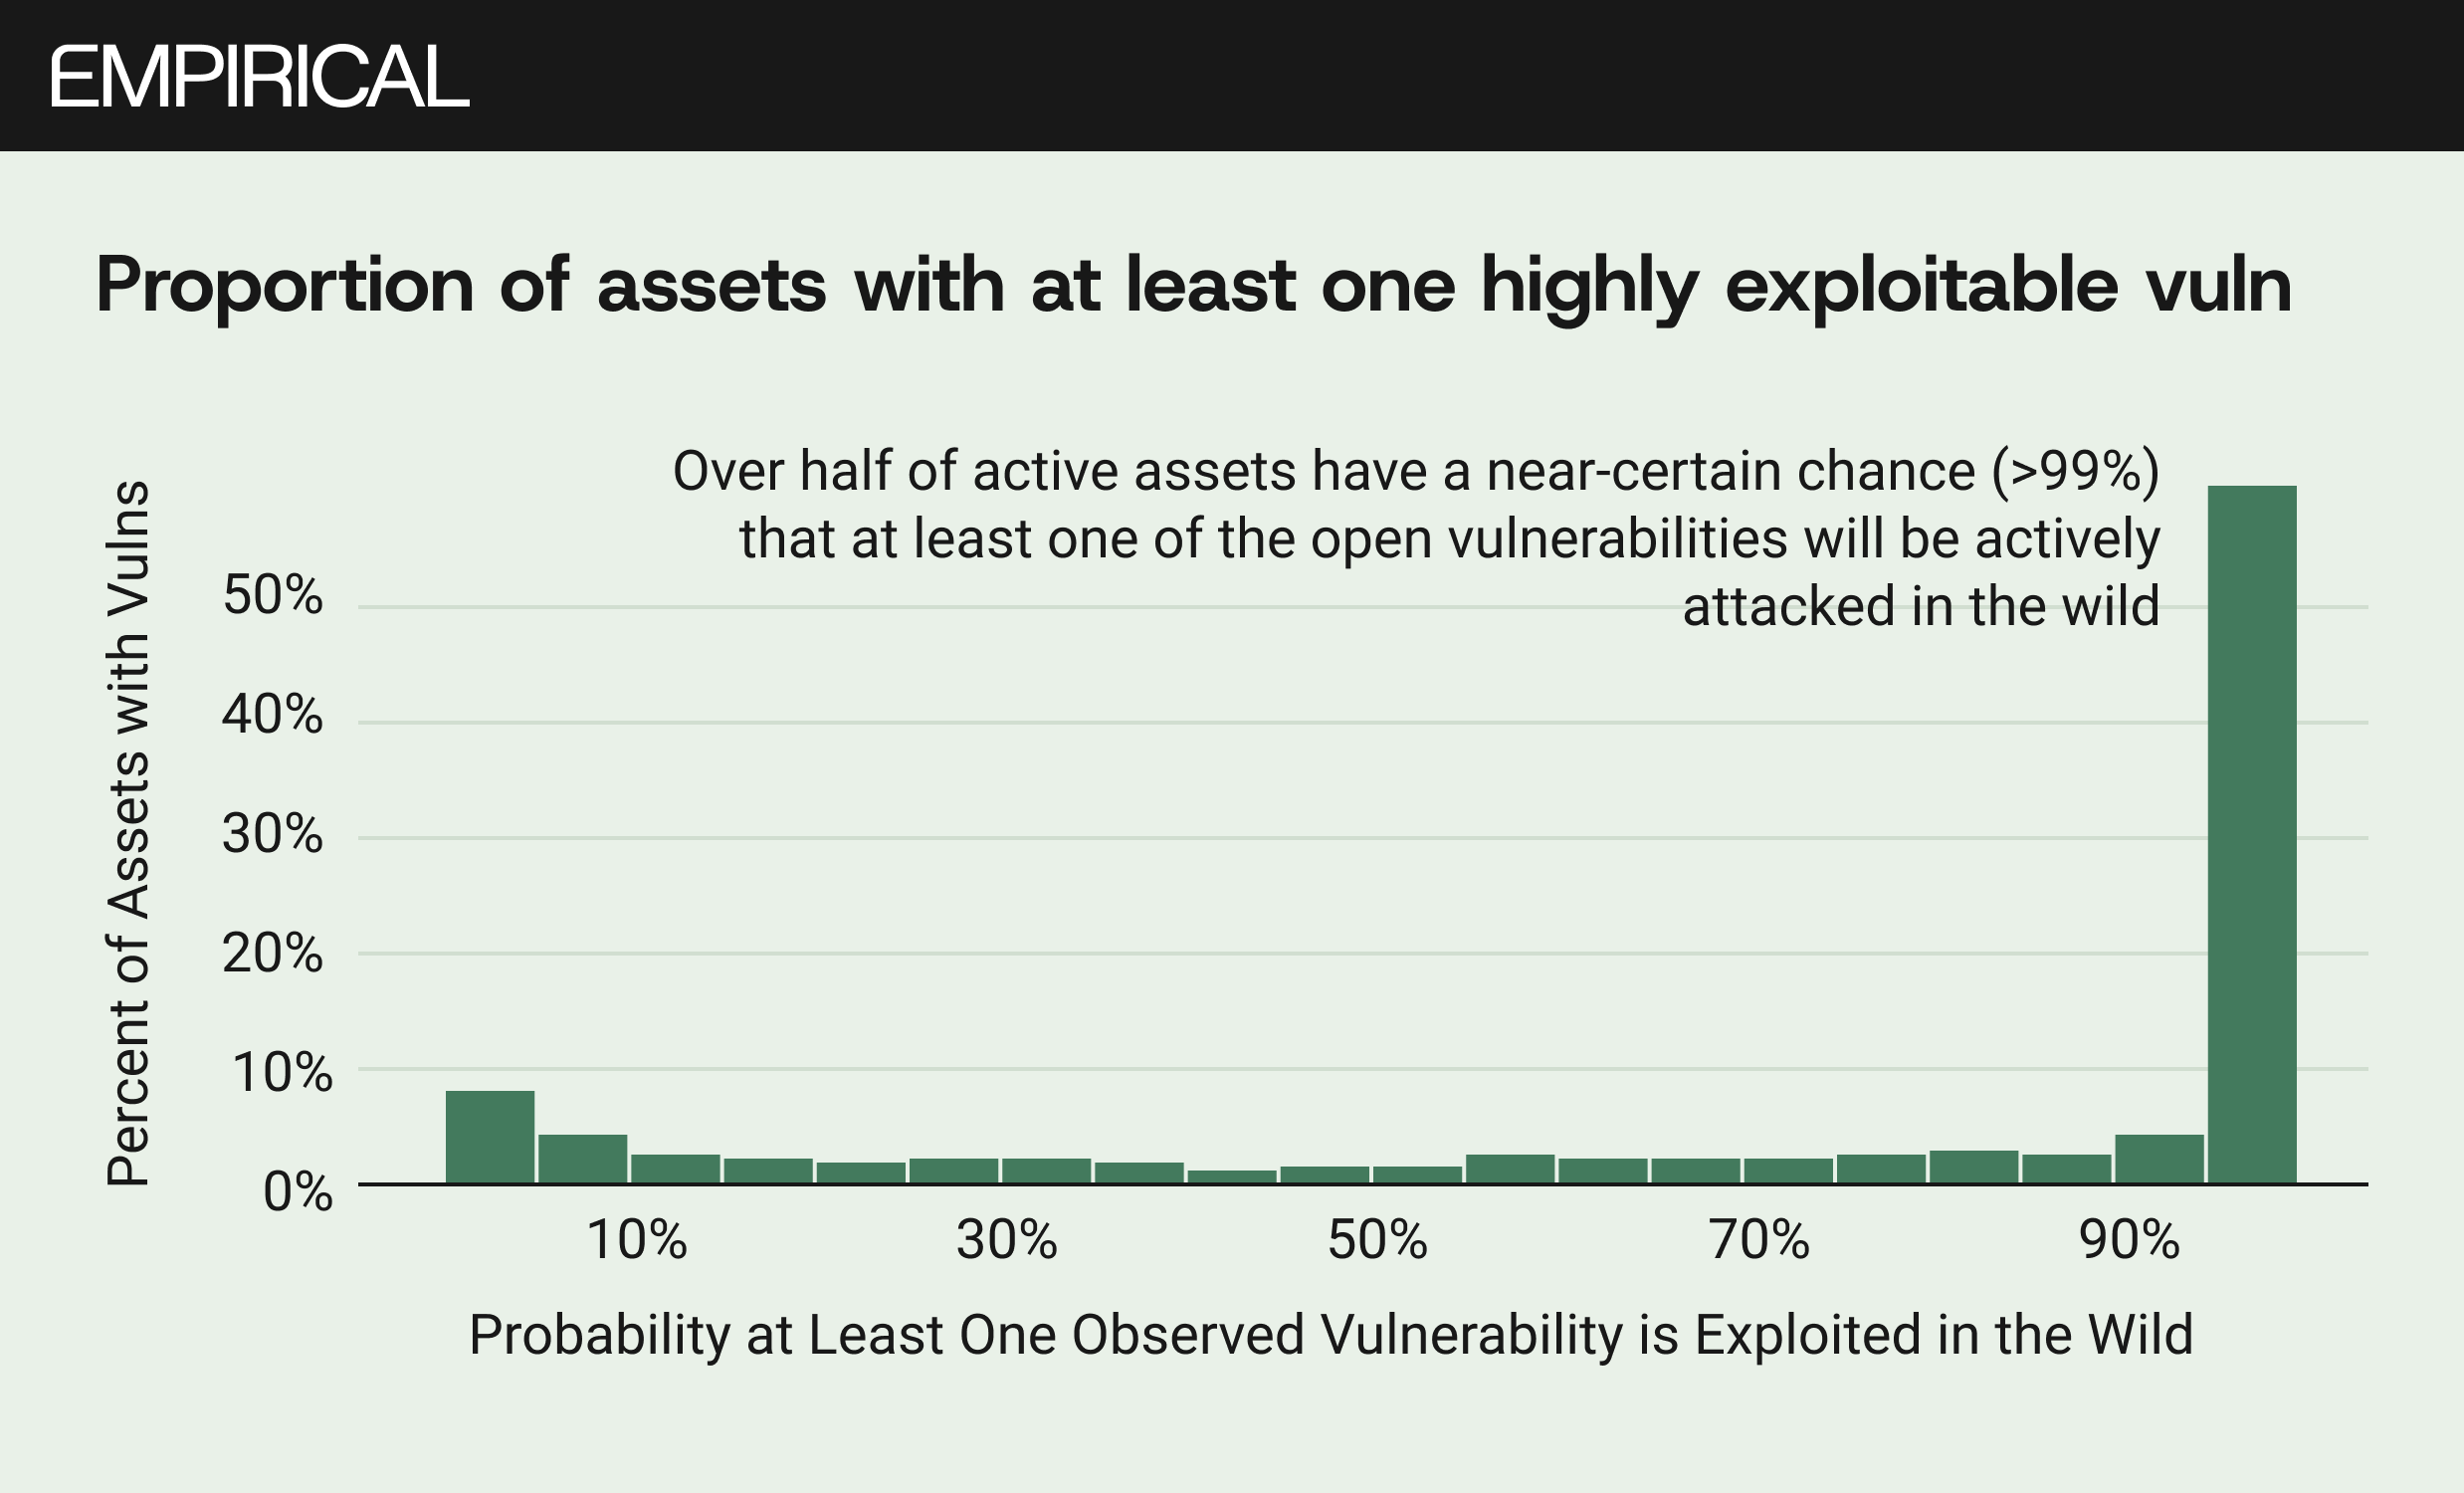
Figure 3 drives the conclusion home at the asset level. More than half of all active assets in the study, 1.8 million of 3.5 million, had a greater than 99% probability that at least one of their open vulnerabilities was being actively exploited somewhere in the wild. Ninety-five percent of assets had at least one vulnerability with a greater than 10% EPSS score, which puts it in the top 5% of all disclosed CVEs.
The practical meaning is uncomfortable but simple. Every asset you manage almost certainly carries at least one vulnerability that sits in the top tier of exploitability. Every organisation with more than a handful of assets is, probabilistically, guaranteed to have something in its environment that is being targeted right now.
This was the state of play with 18,000 CVEs a year. We now publish 131 a day.
What changes and what does not. The structural findings from P2P v8 have not softened with age. If anything, the exponential growth in vulnerability volume has sharpened them. Three points hold:
First, the asset filter remains the single most effective first step. Only about a third of published CVEs are ever detected in enterprise environments. Your environment is a smaller fraction still. The problem is that "a third" of 50,000 is a larger absolute number than "a third" of 18,000. The filter still works, but what passes through it is heavier.
Second, exploitability in production is structurally higher than exploitability across the CVE list. Figure 2 showed this in 2021. With the growth of the CNA ecosystem (365 unique CNAs assigned CVEs in 2025, up from a fraction of that a few years prior) and the concentration of new CVEs in widely deployed software like WordPress plugins and the Linux kernel, the skew has likely increased. The software you actually use is the software that gets attacked. This is not a coincidence. It is an economic fact about exploit development.
Third, the "just fix more" theory of exposure management does not survive contact with the data. The median enterprise closes 15% of its open vulnerabilities per month. That number was roughly stable across P2P volumes spanning several years. Meanwhile, the inflow of new CVEs has grown by a factor of nearly three. The gap is wider now than when these figures were first drawn.
The implication is the one we keep writing about in this series. Strategy dominates capacity. Knowing which 15% to close matters more than closing a larger random sample. And the data to make that decision, exploit code intelligence, observed exploitation telemetry, has never been more available or more necessary.
Five hundred organizations told us this story five years ago. Fifty thousand CVEs a year are telling it louder.